Showing posts with label UK house prices. Show all posts

Thursday, 18 July 2024

How did the last Labour Government impact house prices?

After 14 years in power, the Conservative Government has been ousted by Labour, with Sir Keir Starmer being elected as the UK’s new Prime Minister. A major battleground of the election was focused on housing - both for homeowners and tenants (but not so much for landlords?).

I’ll repeat what I wrote in my previous article though, having described what happened to house prices under the Conservatives:
“No party has ever seen UK house prices decrease during their reign, so those hoping that Labour will get the housing market ‘under control’ by lowering prices may be left disappointed. In fact, it’s almost as if house prices correlate to the popularity of a Prime Minister, which makes you question whether Starmer would actually want them to go down?”

With that in mind, let’s see what happened to house prices the last time Labour were in Government (between May 1997 and May 2010). 

Labour roared to victory as the nation thought ‘things could only get better’ under their watch. For those who jumped onto the property ladder that was largely true, as the average house price in the UK rose from £61,946 in May 1997 to £170,846 in May 2010 when the Conservatives took back control. That equates to a rise of 176% in 13 years; or a compound annual growth rate of 8.1% per year.

It was a tale of two (not quite) halves though. 

As leader of the party, Tony Blair became the Prime Minister when Labour got elected in May 1997 (when the average UK home cost £61,946). He won a second and third election too, before bowing out in June 2007 (with the average UK home then worth £186,348). After a decade in power, he had overseen a rise in house prices of 201% (11.6% annualised); the highest under any Prime Minister in history. 

His departure was quite impeccable in regards to timing the market too, as the financial system around the world began to crack soon after. Leadership passed to his compatriot Gordon Brown on 27th June 2007, who quickly became the man saddled with an economy on the ropes and, with it, a slide in house prices during his term (from £186,348 to £170,846, equating to a decline of 8.3% / -2.9% annualised). This meant he became the first Prime Minister in history whereby house prices fell between the start and finish of his term.

With Liz Truss and Rishi Sunak adding their names to that unenviable list, would Keir Starmer want the same fate to befall him? Perhaps if the rhetoric in this country of house prices increasing being a good thing were reversed then he might. Then again, consider the fact the UK housing market is worth some £8.5trillion. The merry-go-round of increasing prices is what produces equity for people to feel richer and spend money (often via re-mortgaging). If house prices were to fall by 10% that would effectively wipe £850billion off the wealth of the population, which would likely stop them from investing or splurging on holidays, cars and the latest ‘goodies’ i.e the stuff that contributes to the UK’s GDP. To allow that, as the latest Government will surely know, would be political suicide.


This article was featured in...


Thursday, 4 July 2024

What happened to house prices under the Conservatives?

I’m writing this article in the days leading up to the 2024 General Election, but it seems a pretty safe bet to declare that the current Conservative Government is no more. Sir Keir Starmer may well be the Prime Minister by the time you read this, with the Labour party taking a (strong?) majority. 

To mark the end of their reign, let’s take a look at what happened to house prices under the Conservatives these past 14 years.

David Cameron led the Conservatives to victory in the 2010 General Election against Gordon Brown’s Labour party. Without a majority though, he had to negotiate a Conservative-Liberal Democrats coalition before he became Prime Minister on 11th May 2010. The average UK house price stood at £170,846 at that time. 

Despite winning the 2015 General Election outright and freeing himself of Nick Clegg and the Liberal Democrats, he had tied himself to providing a referendum on the UK’s continuing membership of the European Union. Having ‘won’ referendums regarding Scottish Independence (2014) and how the voting system works (2015) it was third time unlucky as the ‘Brexit’ vote went against him. Shortly afterwards, Cameron stood down as Prime Minister on 13th July 2016, having seen the average property in the UK rise in value by 25.9% during his Premiership to sit at £215,127.

Teresa May then danced her way into the hot seat, with many forecasting a dramatic fall in UK house prices due to having exited the EU. Tasked with delivering Brexit she failed to outright win the snap-election called in June 2017 but maintained her authority by buddying-up with Northern Ireland’s Democratic Unionist Party (DUP). Things started well but then began to unravel for her and she stepped down as leader on 24th July 2019. At this point, UK house prices had edged up to an average of £232,618; a rise of 8.1% in the three years she was Prime Minister.

Boris Johnson then became the man at the helm, moving himself and an unconfirmed number of his children into 10 Downing Street. He soon set about tackling the pressing Brexit issues, but failing to win Parliamentary support chose to hold a snap-election in December 2019, in which he won a landslide victory. Pressing ahead with domestic affairs soon took a backseat though as the Covid-19 pandemic locked down the country. House prices were forecast to drop sharply at this point, but instead the vast amount of money committed by then Chancellor of the Exchequer (Rishi Sunak….we’ll come back to him) saw asset prices rise. A variety of scandals saw him depart as Prime Minister on 6th September 2022, whereby house prices in the UK had jumped by 24.1% in a little over three years (standing at £288,901).

The Conservative party held nominations and chose Liz Truss over Rishi Sunak in the final leadership vote. She became the fifteenth and final Prime Minister to serve under Queen Elizabeth II, who died two days after appointing Truss. Just a couple of weeks later Truss commandeered the ‘mini-budget’ that was to spook the markets and the public into losing faith in her ability. On 25th October 2022 she resigned, just 50 days after she had become Prime Minister - the shortest reign in British history (surpassing George Canning, who was prime minister for 119 days in 1827). The data suggests a decrease in house prices during her ’term’, albeit dropping by a mere £196 to stand at £288,705, which is little more than a rounding error.

Nevertheless, Liz Truss became only the second Prime Minister since house price data began to oversee a fall during their time in the top job. It probably won’t surprise you that the Prime Minister in charge during the credit crunch period (Gordon Brown) was the first to suffer this fate, with an 8.3% drop during his premiership between June 2007 and May 2010.

The Conservative party went back to the drawing board and decided the candidate they’d shunned first time round was really the person for the job - Rishi Sunak. Amid a cost of living crisis, energy crisis and ongoing war in Ukraine, house prices have not passed their peak again under Sunak’s Premiership. Despite soaring inflation elsewhere, the average UK house price sits at £281,373 (as of April data); a drop of 2.5% in the less than two-year time that Sunak went from ‘Dishy Rishi’ to ‘Sky dish Rishi’. 

All told then, when the Conservatives regained power in May 2010 the average UK house price was £170,846. They now stand at £281,373; a rise of 64.7% in fourteen years, having peaked and subsequently stagnated in September 2022 - exactly when Liz Truss took office (but also when interest rates stood at 1.75% compared to 5.25% today).

No party has ever seen UK house prices decrease during their reign, so those hoping that Labour will get the housing market ‘under control’ by lowering prices may be left disappointed. In fact, it’s almost as if house prices correlate to the popularity of a Prime Minister, which makes you question whether Starmer would actually want them to go down?


This article was featured in...


Thursday, 22 December 2022

House prices up 14,344% in seventy years


In 1952, the average UK home cost just £1,891. Seventy years later and the average property in the UK is now worth £273,135 - an increase of 14,344% (meaning you could have bought 143 homes in 1952 for the same money as you can now)!

Back then the UK was mostly an island of renters though, with only around four million owning their own home, compared to 15 million homeowners today. Buyers in 1952 were typically paying four times the average salary for a home, compared to eight times today’s average salary now.

It’s not just property that has increased in price though; with a pint of milk costing 4p and a pint of beer costing 9p back in 1952. That does mean though that property prices have outpaced the wider rate of inflation by some margin.

Of course, that meteoric house price growth has not been linear, as the below chart shows:


It seems unlikely we’ll ever see such extravagant house price growth again. To do so would mean the average UK home costing close to £40million in the year 2092! Then again, the way the financial markets have swung about this year, hyperinflation some time in the next seven decades could well make that impossible looking figure a reality. 


This article was featured in...


If you are looking for an agent that is well establishedprofessional and communicative in Chichester, then contact us to find out how we can get the best out of your investment property.

E-mail me on clive@crjlettings.co.uk or call 01243 624 599.

Don't forget to visit the links below to view my previous buy-to-let deals and Chichester Property News articles:

c/o CRJ Lettings, 30B Southgate, Chichester, West Sussex, PO19 1DP


Chichester rental valuation

Thursday, 14 April 2022

House prices rise three times faster than incomes in the past twenty years


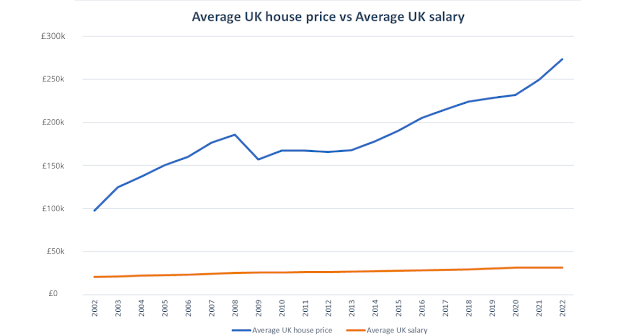
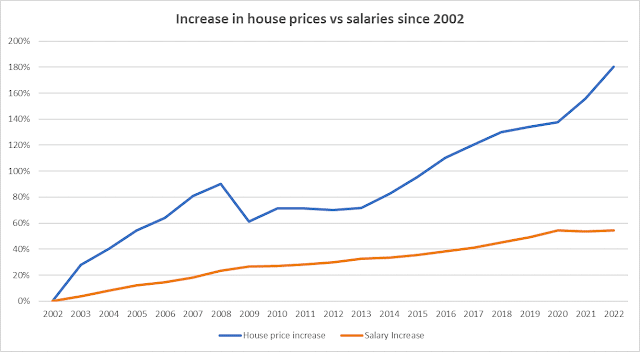
In 2002 the median salary in the UK had just broken through the £20,000 mark for the first time. Twenty years later and that median salary has increased by 54% to now stand at £31,461. Unfortunately, in a world of ever-rising prices, that won’t buy you 54% more stuff, with housing costs one of the most notable testaments to that fact. In the same two decades the average UK house price has increased by 180% (from £97,623 to £273,762), which is more than three times greater than salaries.

That means whereas it would have taken the average earner in 2002 a little under five years to afford to buy the average home (ignoring taxation), it would now take nearer nine years to do so. Plus, the deposit required has increased too, so that the fairly standard 10% deposit required has almost tripled from £9,762 in 2002 to £27,376 today.


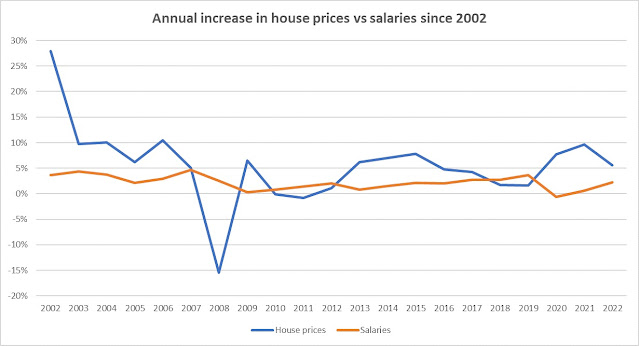
It’s interesting to note that salaries have been fairly steady in their rise, compared to the sharper fluctuations of house prices. Only once did average salaries not increase compared to the year before, whereas house prices saw that happen for several years during the ‘credit crunch’. That one time drop in salaries (of 0.6%) came in 2020, which was almost certainly due to covid stymieing incomes. Their biggest annual increase (4.7%) came in 2007, just before the credit crunch hit. In comparison, the annual change in house prices has been far less predictable, ranging from a drop of 15.4% (in 2008) to an increase of 27.9% (in 2002). 


The past decade has been a little steadier for house prices than the first decade of the millennium though; with their year-on-year change ranging from an increase of just 1.1% (in 2012) to 9.6% (in 2021). Notably, prices have ramped up in the past couple of years, with 2021’s gain having followed a 7.7% increase in 2020. That’s despite doom-mongers predicting a crash when Covid’s first lockdown was announced two years ago, with many would-be buyers even pulling out of purchases as a result. Since then, house prices have risen 18%, whereas incomes are still slightly below where they were when Covid struck.


The sudden jump in house prices these past two years, against a background of static incomes and other fast-rising costs (think energy and petrol prices), is why many are feeling the strain in their personal finances. Consider as well that our pound sterling has been decreasing in value against many other currencies, meaning our buying power is even weaker on a global basis. It is also why a lot of foreign money has come to the UK to sniff out property bargains (in their currency at least), making it even tougher for local workers to be able to afford local homes.


This article was featured in...


Thursday, 8 July 2021

Have house prices peaked?


All the chatter about house prices at the moment is of record increases, with prices up 13.4% over the past year according to Nationwide data. It seems the pandemic and the (rather unnecessary) slashing of stamp duty has stimulated the housing market. As the furlough scheme and other government subsidies wind down though, along with the stamp duty relief also ending, some are saying house prices have peaked.

Whilst history cannot predict the future, I believe it can give an indication of things to come. And so, I put it to you that history suggests house prices will be higher come the year 2030 than they are now…

You see, whilst we’re only 18 months into the current decade, if house prices were to finish the decade where they are today, the 2020’s would have witnessed the lowest growth in recent history. Statistically speaking, that is unlikely. 

Here are the figures dating back to the 1960’s as to each decade’s house price growth:


With house prices in the UK currently averaging £242,709, they have increased 12.4% so far this decade. The average growth over the past six decades is rather skewed due to the 1970’s, but even matching the decade with the lowest growth on record (the 1990’s) would see house prices end this decade at £262,133. It would take some doing to beat the 1970’s huge 409.4% growth though (which came about due to high inflation), with average prices needing to surpass the £1m mark in the next eight years if this were to happen!

Whilst extrapolating forward from the past may bring up seemingly fanciful figures, bear in mind it would have done when done in the past too - and look what happened since then! Furthermore, there’s typically a reason, which only becomes clear in hindsight, as to why things pan out as they do. In the case of house prices, I believe it is the relative affordability due to low interest rates which will be the ‘obvious’ reason house prices continued on a similar trajectory in the future as they have in the past. 

In October 1981 the base rate was at its highest ever (15%), after which rates decreased before increasing again to a similar level by 1991. Since then, the base rate has gradually decreased to the record low of 0.1% we see now (rates were close to 6% in the run up to the credit crunch). This means there will be fewer people falling victim to repossession as mortgages become relatively ‘cheaper’, whilst mortgage spend becomes more affordable despite house prices increasing (put it this way, it costs the same to service a £100,000 debt at 4% interest, than it does a £200,000 debt at 2% interest). 

This simple equation is why people are now spending just 36% of their income to service a typical 80% mortgage, compared to spending 62% in 2008 and 75% of their earnings in 1989. If interest rates stay as low as they are now, I believe there is still plenty of scope for people to afford higher mortgage payments and subsequently they will be willing to pay a higher price for their property.
 

What do you think? Do you expect house prices to continue increasing like they ‘always do’? Or do you think history will show 2021 as being the year everything started to unravel? 


This article was featured in...


Thursday, 19 March 2020

Will property follow the stock market downwards?

I’m writing this as the FTSE 100 has seen another 10% drop amid the collapsing oil price and Coronavirus panic. The index currently sits at 5,238 (12th March close), which means it is down around 30% in just one month! I thought I’d compare the FTSE 100 index and UK house prices over time, to see whether the financial market’s discontent is likely to seep through to the property market

25 years ago the FTSE 100 index stood at 3,217, whilst the average UK home sold for £52,063. The FTSE 100 may have increased by two-thirds since, but house prices have quadrupled in that same timeframe! It hasn’t been a one-way street for either asset class though, with peaks and troughs along the way. Looking at the data, it’s interesting to see that the stock market has had many more ups and downs than house prices though. In fact, house prices have increased pretty steadily since 1995, with the exception of the ‘credit-crunch’ induced financial crisis.

Of course, the greater liquidity of the stock market is the reason for having a wilder ride of things. Property takes rather a long time to buy and sell in comparison to the almost instantaneous process of buying or selling a share. This means people can’t offload properties in an instant like they can shares, which is why the stock market can suddenly collapse like it is doing at the moment.

Interestingly, there have been times whereby the stock market has been heavily impacted by global events and yet the UK housing market hasn’t been affected. At the start of the millennium the dot com bubble burst and with it the FTSE 100 dropped nearly 50% from 6,930 in December 1999 to 3,567 by January 2003. Meanwhile, UK house prices in that time actually rose by 57%, showing that falling share prices doesn’t automatically mean the housing market will follow.

On the other hand, the recent financial crisis saw both the FTSE 100 and house prices take a tumble. Interestingly, they both peaked in October 2007 (the FTSE 100 at 6,722 and UK house prices at £186,044). That suggests the impact was felt upon both markets at the same time, rather than a fall in the stock market leading to a fall in the housing market. Both markets also bottomed out at the same time (February 2009), with the FTSE 100 43% off its peak and UK house prices 21% lower than they had been. It took until May 2014 for house prices to break through its previous high, whilst the stock market recovered more quickly, reaching new heights by October 2013.

The current decline in the financial markets has been much stronger over a shorter timeframe than has been seen before. Whilst this is worrying in regards to the impact it will have on the wider economy, history suggests this doesn’t necessarily mean house prices are set to fall as well. Unfortunately, there’s simply no way of knowing when a market has peaked or bottomed until long after the event!


This article was featured in...


If you are looking for an agent that is well establishedprofessional and communicative in Chichester, then contact us to find out how we can get the best out of your investment property.

E-mail me on clive@crjlettings.co.uk or call 01243 624 599.

Don't forget to visit the links below to view my previous buy-to-let deals and Chichester Property News articles:

c/o CRJ Lettings, 30B Southgate, Chichester, West Sussex, PO19 1DP


Chichester rental valuation

Thursday, 13 February 2020

Which decade was best for house prices?


I recently wrote about how it had gotten tougher during the 2010’s to get on the property ladder, as house prices rose by a third throughout the decade. This wasn’t the highest house price growth seen for any given decade though; far from it in fact. Which decade do you think was best for house prices (or worst depending on whether you were on the ladder or not!)?

Here’s the average cost of a home in the UK at the start of each decade to help you out:

1952: £1,891
1960: £2,170
1970: £4,312
1980: £21,966
1990: £61,495
2000: £74,638
2010: £162,116
2020: £215,925
Looking at the figures showing average house prices over time, most people conclude that the ‘noughties’ had the most growth. With prices shooting up from £74,638 to £162,116 in a decade, the rise of 117% was certainly spectacular. And it’s true that the increase of £87,478 is the largest monetary gain of any decade…but in relative terms, it was actually the Seventies when prices really started to rocket; shooting up 409% in a decade.

It’s very easy when looking at the numbers or a graph to see the huge increase in absolute terms and forget that an increase from 100 to 200 is actually the same in relative terms as an increase from 1 to 2. In fact, the 2000’s and 2010’s were both below the average percentage increase each decade on record has seen.

This made me recall the story my dad had told me when I moaned about how “lucky” he was for being born as part of the ‘baby boomers’. He reminisced how he had bought his first home in 1976 for £12,250, taking out a £8,250 mortgage. “See, you only needed a £4,000 deposit” I scoffed! Before being told he’d saved everything he could to accumulate what was more than the average annual salary at the time and around a third of the value of the property. Plus, he added, my generation haven’t had to deal with 10% unemployment and 15% interest rates.

Still, I said, buying a house for £12,250 seems something of a no-brainer! And yet at the time, my mum’s brother had warned my parents how that £8,250 mortgage would be “a millstone around your neck for the rest of your life”.

One thing my dad did agree he’d been lucky on was not taking out an endowment mortgage! For fear of opening sore wounds amongst some readers, I’ll end my trip down memory lane there…

This article was featured in...


If you are looking for an agent that is well establishedprofessional and communicative in Chichester, then contact us to find out how we can get the best out of your investment property.

E-mail me on clive@crjlettings.co.uk or call 01243 624 599.

Don't forget to visit the links below to view my previous buy-to-let deals and Chichester Property News articles:

c/o CRJ Lettings, 30B Southgate, Chichester, West Sussex, PO19 1DP


Chichester rental valuation