Showing posts with label house price growth. Show all posts

Thursday, 15 September 2022

Property prices increased 14,202% during the Queen’s reign


Queen Elizabeth II’s glorious seventy-year reign has sadly come to an end. When she ascended to the throne in 1952 the average UK home cost just £1,891. Upon her death, the average property was worth £270,452 - an increase of 14,202% (meaning you could have bought 142 homes in 1952 for the same money as you can now)!

Back then the UK was mostly an island of renters though, with only around four million owning their own home, compared to 15 million homeowners today. Buyers in 1952 were typically paying four times the average salary for a home, compared to eight times today’s average salary now.

It’s not just property that has increased in price though; with a pint of milk costing 4p and a pint of beer costing 9p when the Princess became the Queen, times certainly have changed across the land!

Of course, that meteoric house price growth has not been linear, as the below chart shows:


Meanwhile, King Charles III will now move into the most expensive residential home in the world (Buckingham Palace, said to be worth over £1bn). If he were to oversee the same house price growth during his reign, the average UK home would be worth a fanciful £38.4m by the time his heir takes over…

It seems unlikely we’ll ever see such extravagant house price growth again (unless Sterling collapses into hyperinflation). It is also unlikely a future monarch will reach the great milestone of having a Platinum Jubilee, without a tragedy befalling the Royal family. Indeed, it could be several generations until we sing God save the Queen as part of our National Anthem, such is the lineage of the crown. 

I am sure many of you will join me in the sentiment of reflecting upon and thanking the Queen for her service, whilst wishing the best to King Charles III in helping towards a prosperous future for the UK.


This article was featured in...


Thursday, 4 August 2022

UK house prices are DOWN 11% since the credit crunch


With all the headlines about house prices being out of control as they continue to increase to ever higher record highs, you may think I’ve gone a little mad to even suggest property prices in the UK today are lower than they were 15 years ago (when the credit crunch kicked off in mid-2007).

Well, it is in fact true….sort of….

The average UK house price today according to Land Registry data is £283,496. This is indeed some 50% higher than the £188,691 the average UK home was worth in July 2007. However, that is when measuring it in Great British Pounds. Whilst that is certainly the logical thing to do when that is the currency we get paid in and use to pay our mortgages, it doesn’t tell the whole story.

Digging a little deeper shows that house prices have not risen at all….our ‘Great’ British Pound has merely become worth less….a lot less in fact when compared to the US Dollar - the ‘reserve’ currency that is widely used as the benchmark for trade around the world.

You see, in July 2007 when us Brits were paying £188,691 for the average home, we were also able to jet off to the US and exchange one of our pound coins for two US Dollars. That means we were effectively paying $377,382 for that ‘average’ UK home. As anyone who is currently wanting to exchange their pounds for dollars knows, you’ll get far fewer of them now when handing over the same amount of your hard earnt Sterling…with each pound currently being worth just 1.20 dollars. That means the current average UK property (costing £283,496) is actually worth just $340,195….11% less than 15 years ago.

Using the same formulae, the housing crisis in the US appears to be far more extreme than in the UK. The average US property currently costs $381,750, which is a 75% increase compared to their $217,839 peak in June 2007. Already then, our American cousins have seen prices rise far more in their native currency than we have in ours. But it gets worse for them when you consider the strength of the US Dollar. 

Had you emigrated to the US in the middle of 2007 you would have needed £108,920 to buy the average US home (for $217,839). If you now chose to come back to Britain, you could sell your average US home (for $381,750) and convert the sale proceeds back into £318,125….192% more than you started with 15 years ago!

It’s also interesting to look at median salaries both here in the UK and over the pond. Whilst the media shares stories of strikes and people bemoaning pay not keeping up with inflation (especially when it comes to house prices), between 2007 and now the UK median salary has increased by 30% (£24,043 in 2007 to £31,285 now). In the US that figure is a mere 13% ($59,534 in 2007 to $67,521 now). Of course, you now know that’s not the whole story as our pay in dollars has effectively dropped by 22%, whilst the American worker’s median pay has increased by 89% in pounds!
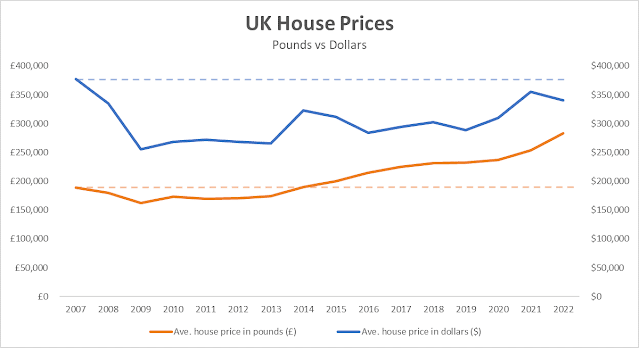

Coming back to the earlier point I made though; it is logical to simply focus on the currency we get paid in and use to pay for our housing. On that score this all adds up to the UK having seen house prices increase 50% since 2007, whilst wages have only increased by 30%. Clearly that’s not a good place to be, but it beats our American friends who have seen house prices increase 75% in the same timeframe, compared to receiving just a 13% rise in their incomes.

Even so, when it comes to affordability, property simply remains expensive in the UK for us Brits - the average home costing 9 times our median salary, whereas in the US, despite a sharper increase in house prices and a slower rise in salaries, they still ‘only’ require 5.7 times the median annual income to afford the average home.

Whilst you may think much of this is irrelevant, the fact is that the world is more inter-connected than ever before, so currency fluctuations distort our wealth on a global scale. We have largely been on the wrong side of this trade for the past 15 years, which is why we have seen a growing number of foreign individuals and companies purchasing property in the UK as it has become ‘cheaper’ in their native currencies.

This article was featured in...


Thursday, 9 June 2022

Property has increased 13,690% during the Queen’s reign

I hope you all had a wonderful long weekend celebrating the Queen’s Platinum Jubilee. As I watched the Queen step out on to the balcony of the most expensive residential home in the world (Buckingham Palace, which is worth over £1bn), I thought it might be interesting to see how property prices have changed since her accession to the throne on the 6th February 1952. 

Back then, the average price of a property in the U.K was just £1,891. Seventy years later and the average property now costs £260,771; an amount which would have bought you 138 homes in 1952! 

Back then the UK was mostly an island of renters though, with only around four million owning their own home, compared to 15 million homeowners today. Buyers in 1952 were typically paying four times the average salary for a home, compared to eight times today’s average salary now.

It’s not just property that has increased in price though; with a pint of milk costing 4p and a pint of beer costing 9p when the Princess became the Queen, times certainly have changed across the land!

Of course, that meteoric house price growth has not been linear, as the below chart shows:

This article was featured in...


Thursday, 8 July 2021

Have house prices peaked?


All the chatter about house prices at the moment is of record increases, with prices up 13.4% over the past year according to Nationwide data. It seems the pandemic and the (rather unnecessary) slashing of stamp duty has stimulated the housing market. As the furlough scheme and other government subsidies wind down though, along with the stamp duty relief also ending, some are saying house prices have peaked.

Whilst history cannot predict the future, I believe it can give an indication of things to come. And so, I put it to you that history suggests house prices will be higher come the year 2030 than they are now…

You see, whilst we’re only 18 months into the current decade, if house prices were to finish the decade where they are today, the 2020’s would have witnessed the lowest growth in recent history. Statistically speaking, that is unlikely. 

Here are the figures dating back to the 1960’s as to each decade’s house price growth:


With house prices in the UK currently averaging £242,709, they have increased 12.4% so far this decade. The average growth over the past six decades is rather skewed due to the 1970’s, but even matching the decade with the lowest growth on record (the 1990’s) would see house prices end this decade at £262,133. It would take some doing to beat the 1970’s huge 409.4% growth though (which came about due to high inflation), with average prices needing to surpass the £1m mark in the next eight years if this were to happen!

Whilst extrapolating forward from the past may bring up seemingly fanciful figures, bear in mind it would have done when done in the past too - and look what happened since then! Furthermore, there’s typically a reason, which only becomes clear in hindsight, as to why things pan out as they do. In the case of house prices, I believe it is the relative affordability due to low interest rates which will be the ‘obvious’ reason house prices continued on a similar trajectory in the future as they have in the past. 

In October 1981 the base rate was at its highest ever (15%), after which rates decreased before increasing again to a similar level by 1991. Since then, the base rate has gradually decreased to the record low of 0.1% we see now (rates were close to 6% in the run up to the credit crunch). This means there will be fewer people falling victim to repossession as mortgages become relatively ‘cheaper’, whilst mortgage spend becomes more affordable despite house prices increasing (put it this way, it costs the same to service a £100,000 debt at 4% interest, than it does a £200,000 debt at 2% interest). 

This simple equation is why people are now spending just 36% of their income to service a typical 80% mortgage, compared to spending 62% in 2008 and 75% of their earnings in 1989. If interest rates stay as low as they are now, I believe there is still plenty of scope for people to afford higher mortgage payments and subsequently they will be willing to pay a higher price for their property.
 

What do you think? Do you expect house prices to continue increasing like they ‘always do’? Or do you think history will show 2021 as being the year everything started to unravel? 


This article was featured in...